
During the month of January 2018, 76.895 more passengers boarded a Brussels Airlines flight compared to the same month in 2017. Both the European and the African sectors recorded significant growth rates. The passenger rise also led to a 5.6 percentage point increase of the seat load factor.
Brussels Airlines started off the New Year with growth. On board of the 5,413 flights that were operated during the past month, Brussels Airlines welcomed 590,329 passengers, or 76,895 more than in January 2017. Mainly on the European and African market the Belgian airline recorded significant growth rates, with respectively a 14.4% and 12.4% increase.
The 15% passenger growth also led to an increase of the seat load factor of 5.6 percentage points, leading to an average seat load factor of 74%.
The freight volumes transported in the belly of Brussels Airlines’ passenger flights also grew significantly (+36%). Thanks to a more effective use of the cargo hold, the cargo load factor grew from 59.4% to 71.6%. This resulted in an increase of the Revenue Ton-Kilometers (RTK) by 24.9%.
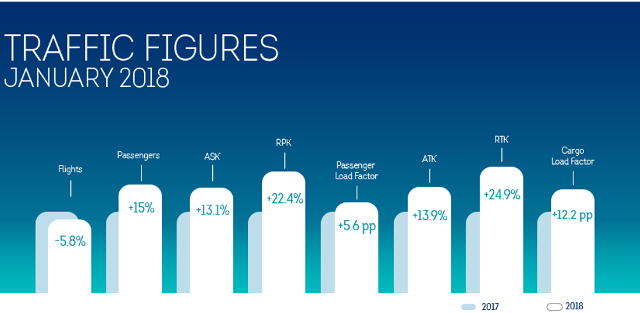
Compared to January last year, Brussels Airlines operated 5.8% less flights. Nevertheless the airline was able to increase its growth rate. This is the result of the replacement of the last AVRO jets (100 seats) by Airbus aircraft with a greater capacity (180 seats). The pressure on airline ticket prices remains high. Thanks to its increased offer, Brussels Airlines was able to continue to propose competitive fares and attract even more customers.
These statistics do not include the passengers on board of the many charter flights Brussels Airlines operates on behalf of tour operators.
| Month | Month | VLY difference
in % |
|
| jan/18 | jan/17 | ||
| Flights | 5,413 | 5,749 | -5.8% |
| Total Passengers | 590,329 | 513,434 | 15.0% |
| Passengers Europe | 458,443 | 400,845 | 14.4% |
| Passengers Africa | 94,986 | 84,491 | 12.4% |
| Passengers North America | 15,445 | 16,394 | -5.8% |
| Passengers Middle East | 11,313 | 11,704 | -3.3% |
| Passengers Asia | 10,142 | / | / |
| Available seat-kilometers (ASK) | 1,461,013,944 | 1,291,669,850 | 13.1% |
| Revenue Passenger- Kilometers (RPK) | 1,085,692,172 | 886,791,848 | 22.4% |
| Passenger Load Factor (%) | 74.3% | 68.7% | 5.6 % pt |
| Available Ton-Kilometers (ATK) | 176,206 | 154,738 | 13.9% |
| Revenue Ton-Kilometers (RTK) | 129,190 | 103,462 | 24.9% |
| Cargo Load Factor (%) | 71.6% | 59.4% | 12.2 % pt |
| These figures are based on preliminary results currently available | |||