
Wednesday, May 10, 2017 — April was an intense month for Brussels Airlines. In total 837,646 passengers flew aboard on a European or intercontinental Brussels Airlines flight. The passenger load factor reached 81%.
April 2017 was the busiest April month for Brussels Airlines. In total the airline welcomed 837,646 passengers on board of its 7,130 flights. 693,166 passengers chose a European flight (more than 82%) and the other 144,480 passengers (more than 17%) flew from or to Africa, North-American, the Middle East or India.
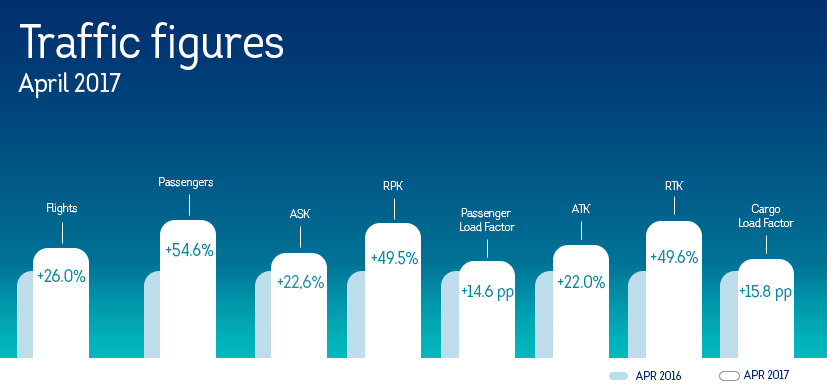
Compared to April 2016, this is a spectacular passenger growth of 54.6 % , a comparison that is however difficult due to the reduced flight program in the aftermath of the March terrorist attacks of last year.
The April passenger numbers l are satisfactory as the seat load factor reached almost 81 %.
The new Mumbai connection, launched at the end of March, already attracted nearly 8,000 passengers in April. Also in April, the Portuguese island Madeira was added to the growing European network. This weekly flight had an encouraging start as well.
The transported freight volume also tended to increase. 162,191 Revenue Ton Kilometres (RTK) were realised. This is an increase of 49.6 % whereas the Available Ton Kilometres only grew with 22 %.
In addition to its scheduled flight activity, Brussels Airlines operates many holiday and group flights for tour operators. Passenger figures for this activity are not included in the figures of this press release.
| Month | Month | VLY difference in % | |
| apr-17 | apr-16 | ||
| Flights | 7,130 | 5,658 | 26.0% |
| Total Passengers | 837,646 | 541,687 | 54.6% |
| — Passengers Europe | 693,166 | 442,712 | 56.6% |
| — Passengers Africa | 82,525 | 61,661 | 33.8% |
| — Passengers North America | 35,456 | 24,697 | 43.6% |
| — Passengers Middle East | 18,583 | 12,617 | 47.3% |
| — Passengers Asia | 7,916 | / | / |
| Available seat-kilometers (ASK) | 1,732,103,375 | 1,412,320,059 | 22.6% |
| Revenue Passenger-Kilometers (RPK) | 1,403,686,142 | 938,871,990 | 49.5% |
| Passenger Load Factor (%) | 81.0% | 66.5% | 14.6%pt |
| Available Ton-Kilometers (ATK) | 207,090 | 169,760 | 22.0% |
| Revenue Ton-Kilometers (RTK) | 162,192 | 108,442 | 49.6% |
| Cargo Load Factor (%) | 63.8% | 48.0% | 15.8%pt |
| Figures based on preliminary figures currently available. | |||